AI did not fix the spreadsheet.It made the inconsistency faster.
A note on AI and comparability in transaction diligence.
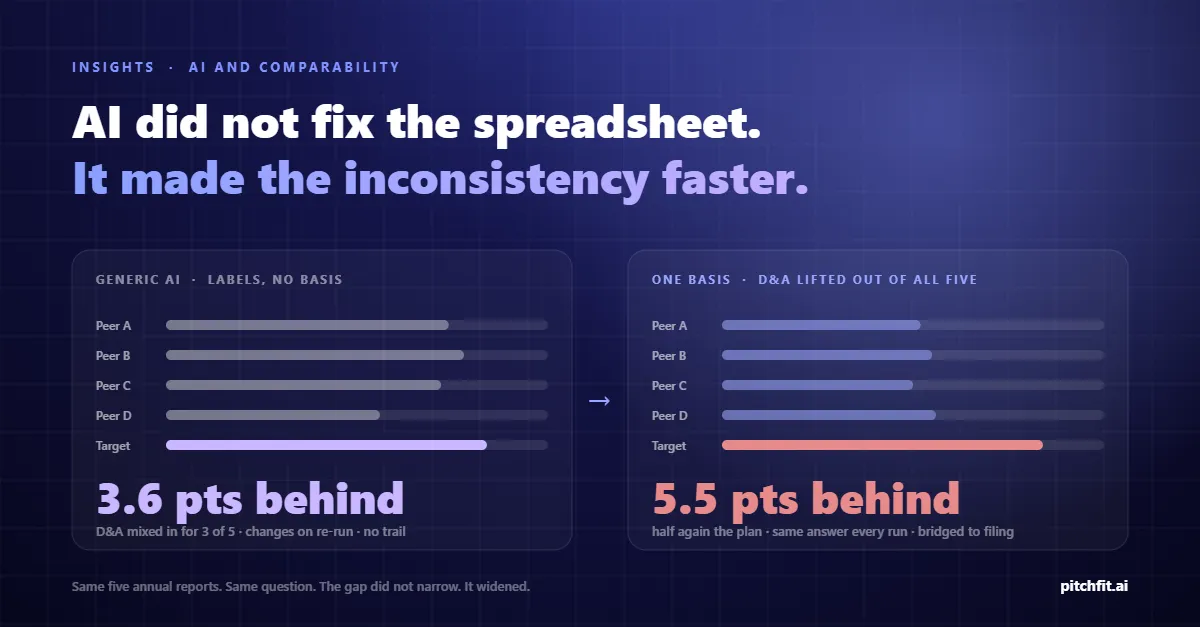
Consider a buy-side diligence in which the team benchmarks the target's cost base against four listed peers using a general-purpose AI tool. The table is clean, fast, and wrong. The tool classifies the same cost differently for each company, leaves no trail, and gives a different answer on the second run. The cost gap at the center of the thesis turns out to be half again as large as the plan assumed, with ten days to committee and a value creation plan to rebuild. Comparability is not a language problem. It is a basis problem, and a general-purpose model does not have one.
The Thursday before committee
The thesis was simple. A mid-cap industrial carrying three to four points more cost than its peers. Close the gap, the equity story works.
Four weeks of diligence. In week two, five annual reports go into an AI tool and the cost exhibit comes back within the hour: cost per employee, SG&A intensity, EBITDA margin gap. It confirms the thesis. The target is 3.6 points behind the peer median. From that day the exhibit sits at the front of every update.
With ten days to committee, the team rehearses the readout, and someone senior asks one question. "Where does depreciation sit in each of these?"
Silence. Then twenty minutes of scrolling.
What the question uncovers
The five companies reported depreciation three different ways. Two buried it inside operating costs with no breakdown in the notes. One buried it but disclosed the figure in a note. Two showed it as its own line.
For a cost benchmark that difference is everything. Cost per employee and SG&A intensity must be measured above EBITDA, before depreciation, or you are measuring how capital-intensive a business is rather than how efficiently it runs. Everyone senior in the room knew that. The tool did not, because nobody had written it a rule.
The target was one of the two that showed depreciation as its own line. Three of the four peers had it buried inside operating costs. So the tool has compared the target's clean operating costs against three peers whose costs were inflated by depreciation they did not strip out. The peers look less efficient than they are. The target looks closer to them than it is.
Lift D&A out of all five and the gap does not narrow. It widens. Not 3.6 points behind the median. 5.5. The cost problem is real, and it is half again as large as the plan assumed. A three-and-a-half point takeout, already an aggressive program, would leave the business two points short of its peers at the end of the hold.
Run the prompt again and the second table treats the note-disclosed company differently from the first. Same documents, same question, different answer.
Why a better prompt will not fix it
Models reason over labels. Comparability requires substance. "Interest income" is core revenue for a bank and non-operating income for a manufacturer, where it belongs below operating profit. Same words, opposite places. "Other operating income" may hold disposal gains, grants, FX or an insurance recovery. "Exceptional items" is whatever management decided this year. Each needs a rule: this reported line, in this kind of company, maps to that canonical line, and this one-off lifts out. Hundreds of rules, applied identically every time. A rule set is a basis. A prompt is a request.
Generic models are not deterministic. A number that changes on refresh is a draft, not a number. In a committee memo that is disqualifying.
There is no trail. Built by hand, the method is slow but visible: you know D&A came out, you know which year was calendarised, you know the lease adjustment went in for all five or none. Built in an hour by a model, that visibility is gone, and with it the ability to defend the exhibit when the other side's advisor stands up. In our survey of 500+ finance professionals, inconsistent classification across companies was the most cited obstacle to comparison, named by 1 in 2. Nearly 3 in 4 already distrust the data under their own analysis. A faster tool with less trail makes both worse.
What it costs
The cost gap is 5.5 points, not 3.6, and no credible cost program closes it alone. A plan built on taking out three and a half points of cost becomes a restructuring narrative in ten days: the cost program kept, growth levers not yet sized added on top, a portfolio review to fund them. The deal can still go ahead on the revised thesis, at a different price. But a clean cost story has become a turnaround story in the last ten days of a four-week process, and the credibility cost of that change lands on the advisors, whoever built the exhibit.
What a basis looks like
The classification decision is made once, by rule, on substance, and applied identically to every company. Every reported line maps to a canonical line regardless of what the filer called it. One-offs lift into their own layer so operating cost means operating cost everywhere. Fiscal years are rebuilt from the quarterlies onto one window. Every figure carries a bridge back to the filing, so when the question comes, the answer is a reference, not a rationalization.
That is PitchFit's Insights, for listed companies and for a private target's own accounts next to its listed peers. And it is what Ask stands on: the figures in any answer come from that basis, so the same question returns the same number every time, sources listed like a research paper, so-what stated.
AI will be in every advisor's workflow. The only question is whether it sits on a basis or on a guess. Every statement, standardized one way. Every figure traced to source. So no one has to choose which version of the numbers to believe.
Illustrative scenario; no specific engagement, firm or company is described. Survey figures from PitchFit's survey of 500+ finance professionals. Join the waitlist at pitchfit.ai.